Most teams add observability after the first production incident. By then they're flying blind — no error context, no timeline, no way to answer "did this affect all users or just one?" This guide sets it up before you need it.
This is SaaS Series #5:
- The Tech Stack I'd Choose in 2026
- Auth in Production: What Clerk Doesn't Document
- Database Migrations Without Downtime
- Stripe Webhooks and Subscriptions
- Observability from Day 1 ← you are here
What "observability" actually means
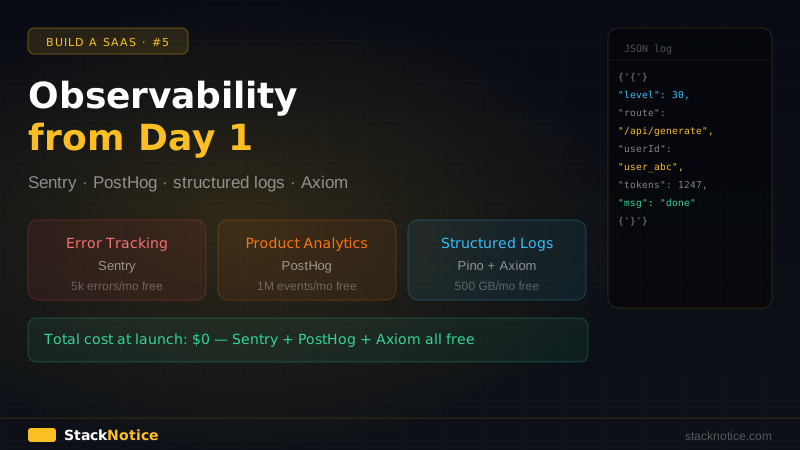
Three pillars, three tools:
| Pillar | What it answers | Tool |
|---|---|---|
| Error tracking | What broke, where, for whom | Sentry |
| Product analytics | What users do, which features they use | PostHog |
| Structured logs | What your app did, in searchable JSON | Pino + Axiom |
console.log doesn't count as any of these. It's not searchable, not persistent beyond the process lifetime in serverless, and not correlated across requests.
Sentry: error tracking that actually helps
Sentry's free tier gives you 5,000 errors/month and 10,000 performance transactions — enough for any early SaaS.
Installation
npx @sentry/wizard@latest -i nextjsThe wizard creates sentry.client.config.ts, sentry.server.config.ts, and sentry.edge.config.ts. Accept the defaults for route instrumentation.
Configuration
// sentry.client.config.ts
import * as Sentry from '@sentry/nextjs'

Sentry.init({
  dsn: process.env.NEXT_PUBLIC_SENTRY_DSN,
  environment: process.env.NODE_ENV,

  // Sample 10% of transactions in production — adjust based on volume
  tracesSampleRate: process.env.NODE_ENV === 'production' ? 0.1 : 1.0,

  // Session replay for debugging UI bugs
  replaysSessionSampleRate: 0.1,
  replaysOnErrorSampleRate: 1.0, // 100% for errors

  integrations: [
    Sentry.replayIntegration({
      maskAllText: true,      // GDPR: mask PII in replays
      blockAllMedia: false,
    }),
  ],

  // Don't send errors from localhost
  enabled: process.env.NODE_ENV === 'production',
})
// sentry.server.config.ts
import * as Sentry from '@sentry/nextjs'
Sentry.init({
dsn: process.env.SENTRY_DSN,
environment: process.env.NODE_ENV,
tracesSampleRate: process.env.NODE_ENV === 'production' ? 0.1 : 1.0,
enabled: process.env.NODE_ENV === 'production',
})Adding user context to errors
Without user context, you get "TypeError: Cannot read properties of undefined" with no idea who was affected or how to reproduce it.
// lib/sentry.ts
import * as Sentry from '@sentry/nextjs'

export function identifyUserInSentry(user: {
  id: string
  email: string
  plan?: string
}) {
  Sentry.setUser({
    id: user.id,
    email: user.email,
    // Custom data visible in Sentry UI
    plan: user.plan,
  })
}

export function clearSentryUser() {
  Sentry.setUser(null)
}
Call this after authentication:
// app/layout.tsx (or a client component that runs after auth)
'use client'
import { useUser } from '@clerk/nextjs'
import { useEffect } from 'react'
import { identifyUserInSentry } from '@/lib/sentry'

export function SentryUserIdentifier() {
  const { user } = useUser()

  useEffect(() => {
    if (user) {
      identifyUserInSentry({
        id: user.id,
        email: user.primaryEmailAddress?.emailAddress ?? '',
        plan: user.publicMetadata.plan as string,
      })
    }
  }, [user])

  return null
}
Capturing custom errors with context
Don't rely only on automatic error capture. Add context when you catch expected errors:
// app/api/generate/route.ts
import * as Sentry from '@sentry/nextjs'

export async function POST(req: Request) {
  const { userId } = await auth()

  try {
    const result = await callAIApi(prompt)
    return Response.json(result)
  } catch (err) {
    // Add business context before sending to Sentry
    Sentry.captureException(err, {
      tags: {
        feature: 'ai-generation',
        userId,
      },
      extra: {
        promptLength: prompt.length,
        model: 'claude-sonnet-4-6',
      },
    })

    return Response.json(
      { error: 'Generation failed' },
      { status: 500 }
    )
  }
}
Custom error boundary for React components
// components/ErrorBoundary.tsx
'use client'
import * as Sentry from '@sentry/nextjs'
import { Component, ReactNode } from 'react'

interface Props {
  children: ReactNode
  fallback?: ReactNode
}

interface State {
  hasError: boolean
  eventId?: string
}

export class ErrorBoundary extends Component<Props, State> {
  constructor(props: Props) {
    super(props)
    this.state = { hasError: false }
  }

  static getDerivedStateFromError() {
    return { hasError: true }
  }

  componentDidCatch(error: Error, info: React.ErrorInfo) {
    const eventId = Sentry.captureException(error, {
      extra: { componentStack: info.componentStack },
    })
    this.setState({ eventId })
  }

  render() {
    if (this.state.hasError) {
      return (
        this.props.fallback ?? (
          <div>
            <p>Something went wrong.</p>
            <button
              onClick={() =>
                Sentry.showReportDialog({ eventId: this.state.eventId })
              }
            >
              Report feedback
            </button>
          </div>
        )
      )
    }

    return this.props.children
  }
}Configure Sentry to alert on: new error types (not seen before), error rate spikes (>10x baseline in 5 min), and performance regressions (p95 latency >2s). Avoid alerting on every single error occurrence.
PostHog: product analytics that respects privacy
PostHog is open source, self-hostable, and ships 1M events/month free on their cloud. It covers analytics, feature flags, session replay, and A/B testing — all in one tool. The complete PostHog + Next.js guide covers the full setup including server-side tracking, A/B testing, and group analytics.
See the feature flags guide for the full PostHog feature flags setup. Here we focus on analytics.
Installation
npm install posthog-js posthog-nodeClient-side provider
// providers/PostHogProvider.tsx
'use client'
import posthog from 'posthog-js'
import { PostHogProvider as PHProvider } from 'posthog-js/react'
import { useEffect } from 'react'

export function PostHogProvider({ children }: { children: React.ReactNode }) {
  useEffect(() => {
    posthog.init(process.env.NEXT_PUBLIC_POSTHOG_KEY!, {
      api_host: '/ingest', // proxy through Next.js to avoid ad blockers
      ui_host: 'https://us.posthog.com',
      capture_pageview: false, // handle manually for SPA routing
      capture_pageleave: true,
      session_recording: {
        maskAllInputs: true, // mask passwords, credit cards
      },
    })
  }, [])

  return <PHProvider client={posthog}>{children}</PHProvider>
}
Add to app/layout.tsx:
// app/layout.tsx
import { PostHogProvider } from '@/providers/PostHogProvider'

export default function RootLayout({ children }: { children: React.ReactNode }) {
  return (
    <html>
      <body>
        <PostHogProvider>
          {children}
        </PostHogProvider>
      </body>
    </html>
  )
}
Proxy to avoid ad blockers
Many users have ad blockers that block analytics requests. Proxy through Next.js:
// next.config.ts
const nextConfig = {
  async rewrites() {
    return [
      {
        source: '/ingest/static/:path*',
        destination: 'https://us-assets.i.posthog.com/static/:path*',
      },
      {
        source: '/ingest/:path*',
        destination: 'https://us.i.posthog.com/:path*',
      },
    ]
  },
  skipTrailingSlashRedirect: true,
}

export default nextConfig
Identifying users
// hooks/usePostHogIdentify.ts
'use client'
import { useUser } from '@clerk/nextjs'
import { usePostHog } from 'posthog-js/react'
import { useEffect } from 'react'

export function usePostHogIdentify() {
  const { user, isSignedIn } = useUser()
  const posthog = usePostHog()

  useEffect(() => {
    if (isSignedIn && user) {
      posthog.identify(user.id, {
        email: user.primaryEmailAddress?.emailAddress,
        name: user.fullName,
        plan: user.publicMetadata.plan,
        createdAt: user.createdAt,
      })
    } else if (!isSignedIn) {
      posthog.reset()
    }
  }, [isSignedIn, user, posthog])
}
Tracking key events
Don't track everything — track events that answer real business questions.
// lib/analytics.ts
import { usePostHog } from 'posthog-js/react'

// Events that matter for a SaaS
export const EVENTS = {
  // Acquisition
  SIGNED_UP: 'signed_up',
  ONBOARDING_COMPLETED: 'onboarding_completed',

  // Activation
  FIRST_PROJECT_CREATED: 'first_project_created',
  FEATURE_USED: 'feature_used',

  // Revenue
  UPGRADE_CLICKED: 'upgrade_clicked',
  CHECKOUT_STARTED: 'checkout_started',
  SUBSCRIPTION_CREATED: 'subscription_created',

  // Retention
  PROJECT_SHARED: 'project_shared',
  EXPORT_USED: 'export_used',
} as const

// Usage in components
export function useTrack() {
  const posthog = usePostHog()

  return (event: string, properties?: Record<string, unknown>) => {
    posthog.capture(event, properties)
  }
}
// In a component
function UpgradeButton({ plan }: { plan: string }) {
const track = useTrack()
return (
<button
onClick={() => {
track(EVENTS.UPGRADE_CLICKED, { plan, location: 'dashboard-banner' })
router.push('/pricing')
}}
>
Upgrade to Pro
</button>
)
}Server-side event capture
For events that happen server-side (Stripe webhooks, cron jobs), use posthog-node:
// lib/analytics-server.ts
import { PostHog } from 'posthog-node'

const posthogClient = new PostHog(process.env.POSTHOG_KEY!, {
  host: 'https://us.i.posthog.com',
  flushAt: 1,     // flush immediately in serverless
  flushInterval: 0,
})

export async function trackServer(
  userId: string,
  event: string,
  properties?: Record<string, unknown>
) {
  posthogClient.capture({
    distinctId: userId,
    event,
    properties,
  })
  await posthogClient.shutdown()
}
// app/api/webhooks/stripe/route.ts
// After subscription is created:
await trackServer(userId, 'subscription_created', {
plan: planName,
interval: 'monthly',
amount: session.amount_total,
})Structured logging with Pino
console.log is fine locally. In production you need logs you can search, filter, and alert on.
Pino writes JSON logs. JSON logs are what log aggregators (Axiom, Datadog, Logtail) can index and query.
npm install pino pino-pretty// lib/logger.ts
import pino from 'pino'
const isDev = process.env.NODE_ENV === 'development'
export const logger = pino({
level: process.env.LOG_LEVEL ?? 'info',
// Pretty-print in dev, JSON in production
...(isDev
? {
transport: {
target: 'pino-pretty',
options: { colorize: true, translateTime: 'HH:MM:ss' },
},
}
: {}),
// Add base fields to every log
base: {
env: process.env.NODE_ENV,
service: 'stacknotice-api',
},
// Redact sensitive fields
redact: ['req.headers.authorization', 'req.headers.cookie', '*.password', '*.token'],
})Use it with child loggers to add request-level context:
// middleware.ts or a request handler wrapper
export function createRequestLogger(requestId: string, userId?: string) {
  return logger.child({
    requestId,
    userId,
  })
}
// app/api/generate/route.ts
import { logger } from '@/lib/logger'
export async function POST(req: Request) {
const requestId = crypto.randomUUID()
const log = logger.child({ requestId, route: '/api/generate' })
log.info('Generation request started')
try {
const result = await callAI(prompt)
log.info({ tokensUsed: result.usage.total_tokens }, 'Generation completed')
return Response.json(result)
} catch (err) {
log.error({ err, promptLength: prompt.length }, 'Generation failed')
throw err
}
}The output in production is searchable JSON:
{"level":30,"time":1716700000000,"requestId":"abc-123","route":"/api/generate","msg":"Generation completed","tokensUsed":1247}
{"level":50,"time":1716700001000,"requestId":"abc-123","route":"/api/generate","msg":"Generation failed","err":{"type":"RateLimitError"},"promptLength":543}
Log aggregation with Axiom
Vercel's log drain sends your logs to a third-party aggregator. Axiom has a free tier (500 GB/month, 30-day retention) and a Vercel integration.
Setup:
- Create account at axiom.co
- In Vercel: Settings → Log Drains → Add drain → select Axiom
- Set
LOG_LEVEL=infoin Vercel environment variables
Once connected, you can query logs in Axiom:
// Find all errors in the last hour
| where level == 50
| where _time > ago(1h)

// Find slow requests
| where route contains "/api"
| where duration > 2000

// Find errors for a specific user
| where userId == "user_abc123"
| where level >= 40
When a user reports a bug, search Axiom for their userId in the last 24 hours. You'll see exactly what they did, what your app did, and where it failed — in seconds instead of hours.
Key metrics to track
Not everything in your DB. Focus on metrics that indicate system health and business health:
Technical metrics (Sentry Performance)
- p95 API response time — alert if >2s for any route
- Error rate by route — alert if >1% errors on any route
- Database query time — alert if any query exceeds 500ms
- Webhook delivery rate — alert if Stripe webhook failures exceed 5%
Business metrics (PostHog)
- Activation rate: % of signups that complete onboarding
- Feature adoption: which features do paying users use vs free users
- Upgrade conversion: % of free users who visit pricing and convert
- Churn leading indicators: users who haven't logged in for 14 days
Setting up alerts
Sentry: Dashboard → Alerts → Create Alert → set threshold and notification channel (Slack/email)
PostHog: Insights → create a funnel or trend → set alert → choose threshold
What to monitor from day 1 vs later
Not everything needs to be set up before launch. Here's what actually matters early:
Before launch (non-negotiable)
- Sentry error tracking with user context
- Basic structured logging (
logger.errorat minimum) - Stripe webhook failure alerting (Stripe Dashboard → Webhooks → alert on failure rate)
- Uptime monitoring (free with Vercel, or Better Uptime)
After first paying customer
- PostHog installed and identifying users
- Activation funnel tracking (signup → onboarding → first feature use)
- Payment failure alerting (already covered in the Stripe article)
After 100 users
- Log aggregation (Axiom or Logtail)
- Database query performance monitoring
- P95 latency alerts for critical paths
After 1,000 users
- Distributed tracing with OpenTelemetry
- Custom dashboards for business KPIs
- SLA monitoring
Sentry: free (5k errors/month). PostHog: free (1M events). Axiom: free (500 GB/month). Vercel log drain: free. Total cost at launch: $0.
Putting it all together: the observable request
Here's what a fully observable request looks like — error tracking, analytics, and structured logging working together:
// app/api/projects/route.ts
import { auth } from '@clerk/nextjs/server'
import * as Sentry from '@sentry/nextjs'
import { logger } from '@/lib/logger'
import { trackServer } from '@/lib/analytics-server'
import { db } from '@/lib/db'

export async function POST(req: Request) {
  const requestId = crypto.randomUUID()
  const log = logger.child({ requestId, route: 'POST /api/projects' })

  const { userId } = await auth()
  if (!userId) {
    log.warn('Unauthenticated request')
    return Response.json({ error: 'Unauthorized' }, { status: 401 })
  }

  const childLog = log.child({ userId })
  childLog.info('Creating project')

  try {
    const body = await req.json()
    const project = await db.insert(projects).values({
      ...body,
      ownerId: userId,
    }).returning()

    childLog.info({ projectId: project[0].id }, 'Project created')

    // Track for product analytics
    await trackServer(userId, 'project_created', {
      projectId: project[0].id,
      template: body.template,
    })

    return Response.json(project[0], { status: 201 })
  } catch (err) {
    childLog.error({ err }, 'Project creation failed')

    // Send to Sentry with context
    Sentry.captureException(err, {
      tags: { route: 'POST /api/projects', userId },
      extra: { requestId },
    })

    return Response.json({ error: 'Failed to create project' }, { status: 500 })
  }
}
Every layer adds context. When something breaks in production, you can trace it from Sentry (what failed) → Axiom logs (full request timeline) → PostHog (what the user was doing before it failed).
Production checklist
Add a test route app/api/test-error/route.ts that throws. Hit it, verify the error appears in Sentry within 30 seconds.
Sign in, check PostHog People → find your email. Verify properties (plan, email) are correct.
Make a request. Check Axiom → verify JSON logs with requestId and userId appear.
Create alerts for: new error types, error rate spike (>10x baseline), p95 latency >2s.
Funnel: signed_up → onboarding_completed → first_project_created. This is your most important metric.
What's next in the series
- SaaS Series #6: CI/CD real — GitHub Actions, preview deploys, staging environments
- SaaS Series #7: Multi-tenancy — organizations, Row-Level Security
Also relevant: feature flags in Next.js covers PostHog's feature flag system, which integrates directly with the analytics setup in this article.